
Q2 2023 Update for Stockholders
Q2 2023 Update for Stockholders
July 27, 2023
Dear Stockholders,
Now more than ever, where you invest matters. We are proud that BREIT has delivered strong performance for our investors across market cycles: +1.8% in the second quarter and a +12% annualized net return (Class I) since inception over six years ago, nearly triple the return of the publicly traded REITs1,2 Our outperformance has always been grounded in using the Blackstone platform’s vast data and insights to invest behind secular shifts and see around corners to construct a high conviction portfolio.
Today, not all real estate is created equal. Higher interest rates and changes in the way we live and work are driving a significant bifurcation in performance across real estate sectors. While there continue to be challenges in commodity office, where BREIT has virtually no exposure, there is still demand for the best real estate in the best markets, which we believe BREIT owns.3 In fact, BREIT’s portfolio has generated an estimated 7%+ cash flow growth YTD, more than double inflation today.4 We are the largest owner of student housing in the United States, an all-weather sector where accelerating supply and demand fundamentals are driving outsized market rent growth of +9% year-over-year.5,6 Similarly, we are seeing unprecedented strength in industrial. The push by consumers for ’2-hour’ vs ’2-day’ delivery is accelerating demand for our last mile warehouses. The combination of this secular shift to e-commerce and onshoring of manufacturing has resulted in record low vacancy of 3% and leases being signed at 43% higher rents than expiring leases.7,8
Just like e-commerce drove demand for warehouses, cloud computing, content creation and the artificial intelligence (“AI”) revolution have driven a 49x increase in data creation and consumption over the last decade.9 Large technology companies are in the midst of an AI arms race which we believe will be a once-in-a-generation engine for future growth in data centers and is driving tremendous demand on the ground. We are capitalizing on this through our ownership of QTS, one of the fastest growing data center companies.10 Since our acquisition, we have tripled QTS’ size and have line of sight to double it again over the next few years through a strong development pipeline.11 With the release of ChatGPT alone, our data center business saw a step function increase in demand, with our leasing pipeline more than doubling since last year.12
BREIT is not the market and where you invest matters. BREIT has delivered outperformance by concentrating in the fastest growing sectors and markets in the U.S.13
Geography and market selection are equally important. BREIT’s top two markets are Florida and Texas, the fastest growing states in 2022.15 BREIT’s recent $800M sale of a hotel asset in Texas, the JW Marriott San Antonio, resulted in a profit of ~$275M, doubling our investors’ capital in just five years.16 In stark contrast, that same week, a different owner defaulted on two hotels in downtown San Francisco with values ultimately declining ~54% since 2016.17 This is not a coincidence: Texas is booming while San Francisco is facing significant challenges. In addition to avoiding challenged urban markets, BREIT has avoided distressed sectors like commodity office, for-sale housing and malls.3 Even before COVID, Blackstone Real Estate saw weakness in the office sector as capital expenditures were rising faster than rents and intentionally reduced its U.S. traditional office exposure from ~60% in 2007 to ~2% today.18,19
While rising interest rates have presented challenges for investors across asset classes, BREIT locked in low rates for over 90% of our balance sheet, insulating and positioning the portfolio for a higher rate environment.20 In addition, BREIT’s structure is working as designed to prevent a liquidity mismatch and maximize shareholder value.21 Since proration began, BREIT has paid out $8.1B to redeeming shareholders and a shareholder who began submitting repurchase requests when proration began has received over 90% of their money back.22,23
Looking ahead, we believe BREIT is poised to perform. Our valuations reflect a higher interest rate environment, having increased our assumed exit cap rates (lowered valuation multiples) in our key sectors by +17% since December 2021.24 Today, inflation is increasingly moving into the rearview mirror, which has helped stabilize long-term interest rates and, in turn, we’ve seen a stabilization of BREIT’s assumed exit cap rates over the past several months. As this major headwind subsides, our high-quality real estate portfolio in the right sectors and markets is generating strong cash flow growth that has not only driven performance year to date, but we believe will continue to do so going forward.4 The fundamentals in our high conviction sectors are solid and we’ve seen ~25%-60%+ declines in new supply in rental housing and industrial due to higher construction and financing costs.25 In addition, BREIT’s rents in our core sectors are below market: in multifamily and industrial specifically, market rents are 18% higher than BREIT’s in-place rents, creating significant embedded rent growth potential.26
No longer does a rising tide lift all boats, and we believe BREIT’s thoughtfully curated portfolio is well positioned today and into the future. We could not be more proud of the portfolio we have built and the performance we have delivered for our investors.
Thank you for your partnership and your continued trust in BREIT.


Maximizing Value and Redeploying Capital
Deployment


Q2 2023 BREIT Highlights
Property Sector14
84%
Concentrated in Rental Housing, Industrial and Data Centers
| Rental Housing* | 56% |
| Industrial | 23% |
| Net Lease | 6% |
| Data Centers | 5% |
| Hospitality | 3% |
| Self Storage | 3% |
| Retail | 2% |
| Office | 2% |
Region Concentration14
71%
Concentrated in the Sunbelt markets of the U.S.
| South | 39% |
| West | 32% |
| East | 17% |
| Midwest | 9% |
| Non-U.S. | 3% |
* Rental Housing includes the following subsectors as a percent of Real Estate TAV: multifamily (36%, including affordable housing, which represents 9%), student housing (11%), single family rental (8%), manufactured housing (1%) and senior housing (<1%).
Key Portfolio Metrics
Performance Summary
Total Returns (% Net of Fees)1
| Share Class | Year to Date | 1-Year | Inception to Date Annualized | |
|---|---|---|---|---|
| Class I | 1.8% | 1.3% | 11.7% | |
| Class D | (No Sales Load) (With Sales Load)35 | 1.8% 0.3% | 1.2% -0.3% | 11.6% 11.4% |
| Class S | (No Sales Load) (With Sales Load)35 | 1.6% -1.8% | 0.8% -2.6% | 10.8% 10.2% |
| Class T | (No Sales Load) (With Sales Load)35 | 1.6% -1.8% | 0.9% -2.5% | 11.1% 10.5% |
Distribution Rates, Annualized36
4.6%
Class I
4.4%
Class D
3.7%
Class S
3.8%
Class T
Download BREIT’s Q2 2023 Update

Past performance does not guarantee future results. Financial data is estimated and unaudited. All figures as of June 30, 2023 unless otherwise noted. Opinions expressed reflect the current opinions of BREIT as of the date appearing in the materials only and are based on BREIT’s opinions of the current market environment, which is subject to change. Certain information contained in the materials discusses general market activity, industry or sector trends, or other broad-based economic, market or political conditions and should not be construed as research or investment advice.
- Represents Class I shares. Please refer to page 4 for additional performance periods for all BREIT share classes. Returns shown reflect the percent change in the NAV per share from the beginning of the applicable period, plus the amount of any distribution per share declared in the period. All returns shown assume reinvestment of distributions pursuant to BREIT’s distribution reinvestment plan, are derived from unaudited financial information, and are net of all BREIT expenses, including general and administrative expenses, transaction-related expenses, management fees, performance participation allocation, and share class-specific fees, but exclude the impact of early repurchase deductions on the repurchase of shares that have been outstanding for less than one year. The inception dates for the Class I, D, S and T shares are January 1, 2017, May 1, 2017, January 1, 2017 and June 1, 2017, respectively. The returns have been prepared using unaudited data and valuations of the underlying investments in BREIT’s portfolio, which are estimates of fair value and form the basis for BREIT’s NAV. Valuations based upon unaudited reports from the underlying investments may be subject to later adjustments, may not correspond to realized value and may not accurately reflect the price at which assets could be liquidated. As return information is calculated based on NAV, return information presented will be impacted should the assumptions on which NAV was determined prove to be incorrect. Past performance is not necessarily indicative of future results. Inception to date (“ITD”) returns are annualized consistent with the IPA Practice Guideline 2018. Second quarter and year to date returns are not annualized.
- Publicly traded REITs reflect the MSCI U.S. REIT Index total return as of June 30, 2023. BREIT’s Class I inception date is January 1, 2017. During the period from January 1, 2017 to June 30, 2023, BREIT’s Class I net return was 2.6x greater than the total return of the MSCI U.S. REIT Index. See Index Definitions for more information about the MSCI index.
- Commodity office refers to Class B and C office. As of June 30, 2023, Class A offices accounted for 2% of BREIT’s real estate asset value.
- Cash flow growth refers to BREIT’s preliminary estimated year to date same property NOI growth for the six months ended June 30, 2023 compared to the same period in the prior year (based on the midpoint of the preliminary estimated range of same property NOI). This data is not a comprehensive statement of our financial results for the six months ended June 30, 2023, and our actual results may differ materially from this preliminary estimated data. Net Operating Income (“NOI”) is a supplemental non-generally accepted accounting principles (“GAAP”) measure of our property operating results that we believe is meaningful because it enables management to evaluate the impact of occupancy, rents, leasing activity and other controllable property operating results at our real estate. We define NOI as operating revenues less operating expenses, which exclude (i) impairment of investments in real estate, (ii) depreciation and amortization, (iii) straight-line rental income and expense, (iv) amortization of above- and below-market lease intangibles, (v) lease termination fees, (vi) property expenses not core to the operations of such properties, and (vii) other non-property related revenue and expense items such as (a) general and administrative expenses, (b) management fee paid to the Adviser, (c) performance participation allocation paid to the Special Limited Partner, (d) incentive compensation awards, (e) income (loss) from investments in real estate debt, (f) change in net assets of consolidated securitization vehicles, (g) income from interest rate derivatives, (h) net gain (loss) on dispositions of real estate, (i) interest expense, (j) gain (loss) on extinguishment of debt, (k) other income (expense), and (l) similar adjustments for NOI attributable to non-controlling interests and unconsolidated entities. We evaluate our consolidated results of operations on a same property basis, which allows us to analyze our property operating results excluding acquisitions and dispositions during the periods under comparison. Properties in our portfolio are considered same property if they were owned for the full periods presented, otherwise they are considered non-same property. Recently developed properties are not included in same property results until the properties have achieved stabilization for both full periods presented. Properties held for sale, properties that are being re-developed, and interests in unconsolidated entities under contract of sale with hard deposit or other factors ensuring the buyer’s performance are excluded from same property results and are considered non-same property. We do not consider our investments in the real estate debt segment or equity securities to be same property. For more information, please refer to BREIT’s Current Report on Form 8-K filed with the Securities and Exchange Commission on July 19, 2023 and the prospectus. Additionally, please refer to page 8 for a reconciliation of estimated GAAP net (loss) income to same property NOI for the year to date periods ended June 30, 2023 and 2022. Based on 3% inflation reflecting U.S. Bureau of Labor Statistics data as of June 30, 2023 and represents the Consumer Price Index, which measures year-over-year changes in the prices paid by all urban consumers for a basket of goods and services consisting of all items in U.S. city average, not seasonally adjusted. NOI may not be correlated to or continue to keep pace with inflation and may slow as inflation slows. Inflation has ranged from 6.4% in January 2023 to 3% in June.
- Blackstone Proprietary Data and Axiometrics, as of June 30, 2023. New supply reflects beds under construction as a percentage of enrollment at the top 175 public universities by size, weighted by asset value in each ACC portfolio market. Under construction represents average annual completions delivering in 2023 and 2024. Demand represented by Axiometrics, Blackstone Proprietary Data, as of June 30, 2023. Reflects enrollment by academic year at the top 175 public universities by size, weighted by asset value in each ACC portfolio market.
- Student housing reflects Blackstone Proprietary Data as of July 7, 2023 and is based on a 9% increase in rents for the 2023-24 academic year compared to 2022-23 academic year based on 93% pre-leasing to date; assumes current asking rents are achieved for the remainder of the lease-up, of which there can be no assurance, and this information should not be considered an indication of future performance.
- As of June 30, 2023. Vacancy reflects trailing 12-month average in BREIT’s industrial portfolio.
- As of June 30, 2023. Represents quarterly leasing spreads and compares new or renewal rents to prior rents or expiring rents, as applicable in BREIT’s industrial portfolio.
- International Data Corporation (IDC), as of December 31, 2022. 2021 and 2022 represent year-end estimates. 49x represents comparison between 2010 and 2022.
- BREIT’s ownership interest in QTS was 33.5% as of June 30, 2023 and the QTS investment accounted for 3.2% of BREIT’s real estate asset value. “One of the fastest growing” reflects SEC filings of peers in the broader data center industry and Blackstone Proprietary Data, as of December 31, 2022. Represents comparison to publicly traded data center REITs measured by revenue growth.
- Based on leased megawatts at acquisition vs. June 30, 2023.
- Blackstone Proprietary Data, as of June 30, 2023. Reflects comparison between BREIT’s data center leasing pipeline as of June 30, 2023, and BREIT’s 2022 total data center leasing. There can be no assurance that these leases will commence on their current terms, or at all, and this information should not be considered an indication of future performance.
- Fastest growing sectors reflects FTSE Nareit data and represents performance of residential, industrial and data center publicly traded REITs since BREIT’s inception, as of June 30, 2023. Fastest growing markets reflect higher population growth and job growth in the South / West markets compared to the rest of the U.S. Population growth reflects U.S. Bureau of Economic Analysis, as of June 22, 2022. Represents 5-year compound annual growth rate of population from mid-quarter Q1 2017 to mid-quarter Q1 2022. Job growth reflects U.S. Bureau of Labor Statistics data as of September 16, 2022. Represents 5-year compound annual growth rate of seasonally adjusted employees on nonfarm payrolls from August 2017 to August 2022. While BREIT generally seeks to acquire real estate properties located in growth markets, certain properties may not be located in such markets. Sunbelt represents the South and West regions as defined by the National Council of Real Estate Investment Fiduciaries (“NCREIF”). Diversification does not assure a profit or protect against a loss in a declining market. A diversified portfolio does not eliminate risk or indicate a higher level of returns.
- “Property Sector Concentration” weighting is measured as the asset value of real estate investments for each sector category (rental housing, industrial, net lease, data centers, self storage, hospitality, office, retail) divided by the total asset value of all real estate investments, excluding the value of any third-party interests in such real estate investments (“Real Estate TAV”). The following sectors each have subsectors comprising over 1.0% of Real Estate TAV. Rental housing: multifamily (36%, including affordable housing, which accounts for 9%), student housing (11%), single family rental housing (8%) and manufactured housing (1%); industrial: warehouses (22%); and hospitality: select service hotels (2%). “Region Concentration” represents regions as defined by the National Council of Real Estate Investment Fiduciaries (“NCREIF”) and the weighting is measured as the asset value of real estate properties and unconsolidated property investments for each regional category (South, West, East, Midwest, Non-U.S.) divided by the total asset value of all (1) real estate properties, excluding the value of any third-party interests in such real estate properties, and (2) unconsolidated property investments. Sunbelt refers to the South and West regions. Our portfolio is currently concentrated in certain industries and geographies, and, as a consequence, our aggregate return may be substantially affected by adverse economic or business conditions affecting that particular type of asset or geography.
- U.S. Census Bureau, as of December 22, 2022. Represents numeric population growth from July 1, 2021 to July 1, 2022. The select markets that are named represent BREIT’s largest two states by portfolio weighting. BREIT is invested in additional states which are not named above.
- Profit reflects BREIT’s net sale proceeds and cumulative income. Past performance is not necessarily indicative of prior performance and this transaction may not be representative of future dispositions or BREIT’s other portfolio holdings.
- 2016 value represents HVS Consulting and Valuation Services valuation as part of the loan origination in 2016. Today’s value represents $725M loan balance which Park Hotels & Resorts announced on June 5, 2023 that it has ceased payments on.
- This material makes reference to Blackstone, a premier global investment manager. The real estate group of Blackstone, Blackstone Real Estate, is BREIT’s sponsor and an affiliate of the BREIT Adviser. Information regarding Blackstone and Blackstone Real Estate is included to provide information regarding the experience of BREIT’s sponsor and its affiliates. An investment in BREIT is not an investment in BREIT’s sponsor or Blackstone as BREIT is a separate and distinct legal entity.
- Blackstone Proprietary Data, as of March 31, 2023. ~60% in 2007 represents Blackstone’s global opportunistic real estate private equity funds’ 61% holdings in U.S. office by value in Q2 2007. Today represents U.S. office as a percentage of Blackstone Real Estate’s global real estate holdings as of March 31, 2023.
- Percentage fixed rate financing is measured by dividing (i) the sum of our consolidated fixed rate debt, secured financings on investments in real estate debt with matched underlying interest rate exposure, and the outstanding notional principal amount of corporate and consolidated investment interest rate swaps, by (ii) total consolidated debt outstanding. 6+ year duration reflects the weighted average duration of fixed and swapped consolidated property level and entity level debt. Excludes BREIT’s pro rata share of debt within its unconsolidated real estate investments.
- Refers to the up to 2% of NAV monthly repurchase limit and up to 5% of NAV quarterly repurchase limit under the Repurchase Plan. For the avoidance of doubt, both of these limits are assessed during each month in a calendar quarter. Pursuant to the Repurchase Plan, BREIT may choose to repurchase only some, or even none, of the shares that have been requested to be repurchased in its discretion at any time. Further, our Board of Directors may make exceptions to, modify or suspend the Repurchase Plan. Please see BREIT’s prospectus, periodic reporting and www.breit.com for more information on the Repurchase Plan.
- Refers to aggregate repurchase requests fulfilled from November 30, 2022 to June 30, 2023.
- Reflects repurchase proceeds received assuming an investor has submitted repurchase requests monthly since November 2022.
- Blackstone Proprietary Data, as of June 30, 2023. Reflects the percent change in BREIT’s weighted average rental housing and industrial assumed exit cap rate for its real estate portfolio from December 31, 2021 to June 30, 2023, weighted by BREIT’s asset value in each sector for the respective time period. BREIT’s asset values are calculated monthly through a robust valuation process and include ground-up, asset-by-asset valuations that reflect real time inputs, allowing us to make dynamic adjustments as the market evolves. For further information, please refer to the ’Net Asset Value Calculation and Valuation Guidelines’ in BREIT’s prospectus, which describe our valuation process and the independent third parties who assist us.
- Rental housing new supply reflects U.S. Census Bureau, as of June 30, 2023. Represents decline in seasonally adjusted U.S. new privately owned housing units authorized in permit-issuing places from 2022 peak of the trailing three-month period ended February 28, 2022 to the trailing three-month period ended June 30, 2023. Includes single and multifamily dwellings. Privately owned housing units authorized in permit-issuing places reflect the earliest phase of a residential construction project as defined by the U.S. Census Bureau and is distinct from later phases such as starts, under construction and completed housing units, which may differ in volume over a given period. As of June 30, 2023, the rental housing sector accounted for 56% of BREIT’s real estate asset value. Industrial new supply reflects CoStar data as of July 17, 2023 and represents the new construction starts in the industrial sector for Q2 2023 vs. recent peak (Q3 ’22). As of June 30, 2023, the industrial sector accounted for 23% of BREIT’s real estate asset value.
- As of June 30, 2023. Represents our estimate of the embedded growth potential between BREIT’s in-place multifamily and industrial portfolio rents and achievable market rents. We estimate that BREIT’s multifamily (excluding affordable housing) in-place rent roll has a 2% embedded growth potential and that BREIT’s industrial in-place rent roll has a 35% embedded growth potential. Reflects Blackstone Proprietary Data. Does not represent the entirety of BREIT’s portfolio and is not a measure, or indicative, of overall portfolio performance or returns. Other BREIT property sectors may have lower embedded growth potential. Any expectations that in-place rents have the potential to increase are based on certain assumptions that may not be correct and on certain variables that may change, are presented for illustrative purposes only and do not constitute forecasts. There can be no assurance that any such results will actually be achieved. Embedded rent growth will not directly correlate with increased returns. A number of factors, including operating expenses as described in Note 4 will impact BREIT’s net returns and performance. BREIT’s industrial assets have a 4.1-year weighted average lease length and BREIT’s rental housing assets have an approximately 0.5-year weighted average lease length. Reflects real estate properties only, including unconsolidated properties, and does not include real estate debt investments. For a complete list of BREIT’s real estate investments (excluding equity in public and private real estate-related companies), visit www.breit.com/properties. As of June 30, 2023, the multifamily (excluding affordable housing) sector accounted for 27% of BREIT’s real estate asset value and the industrial sector accounted for 23% of BREIT’s real estate asset value.
- Occupancy is an important real estate metric because it measures the utilization of properties in the portfolio. Occupancy is weighted by the total value of all consolidated real estate properties, excluding our hospitality investments, and any third-party interests in such properties. For our industrial, data center, retail and office investments, occupancy includes all leased square footage as of the date indicated. For our multifamily and student housing investments, occupancy is defined as the percentage of actual rent divided by gross potential rent (defined as actual rent for occupied units and market rent for vacant units) for the three months ended on the date indicated. For our net lease investments, occupancy includes leased properties as of the date indicated. For our single family rental housing investments, the occupancy rate includes occupied homes for the three months ended on the date indicated. For our self storage, manufactured housing and senior living investments, the occupancy rate includes occupied square footage, occupied sites and occupied units, respectively, as of the date indicated. The average occupancy rate for our hospitality investments was 72% for the twelve months ended June 30, 2023. Hospitality investments owned less than twelve months are excluded from the average occupancy rate calculation.
- Includes dispositions closed and under non-refundable contract since January 1, 2022 as of July 24, 2023. Includes $3.1B of assets under non-refundable contract. Premium represents the gross sales price of BREIT assets sold relative to BREIT’s real estate asset value as of three months prior to sale for those assets. Analysis excludes sales in our single family rental housing and affordable housing sectors where certain third parties, including existing tenants and joint venture partners, have certain buyout rights that may not be reflective of market value. There can be no assurance that dispositions under non-refundable contract but not yet closed will close as expected or at all.
- Reflects total cost for committed development projects of QTS as of June 30, 2023, at 100% share. There is no assurance that committed but not yet closed transactions will close as expected or at all. As of June 30, 2023, BREIT’s ownership interest in QTS was 33.5% and the QTS investment accounted for 3.2% of BREIT’s real estate asset value.
- Reflects estimated total development costs of ACC as of June 30, 2023, at 100% ownership. As of June 30, 2023, BREIT’s ownership in ACC was 69%. There can be no assurance that these projects will commence on their current terms, or at all, and this information should not be considered an indication of future performance.
- Total asset value is measured as (i) the asset value of real estate investments (based on fair value), excluding any third party interests in such real estate investments, plus (ii) the equity in our real estate debt investments measured at fair value (defined as the asset value of our real estate debt investments less the financing on such investments), but excluding any other assets (such as cash or any other cash equivalents). The total asset value would be higher if such amounts were included and the value of our real estate debt investments was not decreased by the financing on such investments.
- Number of properties reflects real estate investments only, including unconsolidated properties, and does not include real estate debt investments. Single family rental homes are not reflected in the number of properties.
- Our leverage ratio is measured by dividing (i) consolidated property-level and entity-level debt net of cash and loan-related restricted cash, by (ii) the asset value of real estate investments (measured using the greater of fair market value and cost) plus the equity in our settled real estate debt investments. Indebtedness incurred (i) in connection with funding a deposit in advance of the closing of an investment or (ii) as other working capital advances will not be included as part of the calculation above. The leverage ratio would be higher if the indebtedness on our real estate debt investments and the pro rata share of debt within our unconsolidated investments were taken into account. The use of leverage involves a high degree of financial risk and may increase the exposure of the investments to adverse economic factors.
- Investment allocation is measured as the asset value of each investment category (real estate investments or real estate debt investments) divided by the total asset value of all investment categories, excluding the value of any third party interests in such assets. “Real estate investments” include wholly-owned property investments, BREIT’s share of property investments held through joint ventures and equity in public and private real estate-related companies. “Real estate debt investments” include BREIT’s investments in commercial mortgage-backed securities, residential mortgage-backed securities, mortgage loans and other debt secured by real estate and real estate related assets, as described in BREIT’s prospectus. The Consolidated GAAP Balance Sheet included in our annual and interim financial statements reflects the loan collateral underlying certain of our real estate debt investments on a gross basis. These amounts are excluded from our real estate debt investments as they do not reflect our economic interest in such assets.
- Assumes payment of the full upfront sales charge at initial subscription (1.5% for Class D shares; 3.5% for Class S and Class T shares). The sales charge for Class D shares became effective May 1, 2018.
- Reflects the current month’s distribution annualized and divided by the prior month’s NAV, which is inclusive of all fees and expenses. Distributions are not guaranteed and may be funded from sources other than cash flow from operations, including, without limitation, borrowings, the sale of our assets, repayments of our real estate debt investments, return of capital or offering proceeds, and advances or the deferral of fees and expenses. We have no limits on the amounts we may fund from such sources. As of June 30, 2023, 100% of inception to date distributions were funded from cash flows from operations.
Important Disclosure Information
Blackstone Proprietary Data. Certain information and data provided herein is based on Blackstone proprietary knowledge and data. Portfolio companies may provide proprietary market data to Blackstone, including about local market supply and demand conditions, current market rents and operating expenses, capital expenditures and valuations for multiple assets. Such proprietary market data is used by Blackstone to evaluate market trends as well as to underwrite potential and existing investments. While Blackstone currently believes that such information is reliable for purposes used herein, it is subject to change, and reflects Blackstone’s opinion as to whether the amount, nature and quality of the data is sufficient for the applicable conclusion, and no representations are made as to the accuracy or completeness thereof.
Select Images. The selected images of certain BREIT investments in this presentation are provided for illustrative purposes only, are not representative of all BREIT investments of a given property type and are not representative of BREIT’s entire portfolio. It should not be assumed that BREIT’s investment in the properties identified and discussed herein were or will be profitable. Please refer to www.breit.com/properties for a complete list of BREIT’s real estate investments (excluding equity in public and private real estate related companies), including BREIT’s ownership interest in such properties.
Third Party Information. Certain information contained in this material has been obtained from sources outside Blackstone, which in certain cases have not been updated through the date hereof. While such information is believed to be reliable for purposes used herein, no representations are made as to the accuracy or completeness thereof and none of Blackstone, its funds, nor any of their affiliates takes any responsibility for, and has not independently verified, any such information.
Trends. There can be no assurances that any of the trends described herein will continue or will not reverse. Past events and trends do not imply, predict or guarantee, and are not necessarily indicative of, future events or results.
Index Definitions
An investment in BREIT is not a direct investment in real estate, and has material differences from a direct investment in real estate, including those related to fees and expenses, liquidity and tax treatment. BREIT’s share price is subject to less volatility because its per share NAV is based on the value of real estate assets it owns and is not subject to market pricing forces as are the prices of the asset classes represented by the indices presented. Although BREIT’s share price is subject to less volatility, BREIT shares are significantly less liquid than these asset classes, and are not immune to fluctuations. Private real estate is not traded on an exchange and will have less liquidity and price transparency. The value of private real estate may fluctuate and may be worth less than was initially paid for it.
The volatility and risk profile of the indices presented is likely to be materially different from that of BREIT including those related to fees and expenses, liquidity, safety, and tax features. In addition, the indices employ different investment guidelines and criteria than BREIT; as a result, the holdings in BREIT may differ significantly from the holdings of the securities that comprise the indices. The indices are not subject to fees or expenses, are meant to illustrate general market performance and it may not be possible to invest in the indices. The performance of the indices has not been selected to represent an appropriate benchmark to compare to BREIT’s performance, but rather is disclosed to allow for comparison of BREIT’s performance to that of well-known and widely recognized indices. A summary of the investment guidelines for the indices presented is available upon request. In the case of equity indices, performance of the indices reflects the reinvestment of dividends.
BREIT does not trade on a national securities exchange, and therefore, is generally illiquid. Your ability to redeem shares in BREIT through BREIT’s share repurchase plan may be limited, and fees associated with the sale of these products can be higher than other asset classes. In some cases, periodic distributions may be subsidized by borrowed funds and include a return of investor principal. This is in contrast to the distributions investors receive from large corporate stocks that trade on national exchanges, which are typically derived solely from earnings. Investors typically seek income from distributions over a period of years. Upon liquidation, return of capital may be more or less than the original investment depending on the value of assets.
An investment in BREIT differs from the MSCI U .S. REIT Index in that BREIT is not a publicly traded U.S. Equity REIT. The MSCI U.S. REIT Index is a free float-adjusted market capitalization index that is comprised of equity REITs. The index is based on the MSCI USA Investable Market Index (IMI), its parent index, which captures large, mid and small cap securities. It represents about 99% of the U.S. REIT universe. The index is calculated with dividends reinvested on a daily basis. An investment in private real estate differs from the MSCI U.S. REIT Index in that private real estate investments are not publicly traded U.S. Equity REITs.
Forward-Looking Statements
This material contains forward-looking statements within the meaning of the federal securities laws and the Private Securities Litigation Reform Act of 1995. These forward-looking statements can be identified by the use of forward-looking terminology such as “outlook,” “indicator,” “believes,” “expects,” “potential,” “continues,” “identified,” “may,” “will,” “should,” “seeks,” “approximately,” “predicts,” “intends,” “plans,” “estimates,” “anticipates”, “confident,” “conviction” or other similar words or the negatives thereof. These may include financial estimates and their underlying assumptions, statements about plans, objectives, intentions, and expectations with respect to positioning, including the impact of macroeconomic trends and market forces, future operations, repurchases, acquisitions, future performance and statements regarding identified but not yet closed acquisitions or dispositions. Such forward-looking statements are inherently subject to various risks and uncertainties. Accordingly, there are or will be important factors that could cause actual outcomes or results to differ materially from those indicated in such statements. We believe these factors include but are not limited to those described under the section entitled “Risk Factors” in BREIT’s prospectus and annual report for the most recent fiscal year, and any such updated factors included in BREIT’s periodic filings with the SEC, which are accessible on the SEC’s website at www.sec.gov. These factors should not be construed as exhaustive and should be read in conjunction with the other cautionary statements that are included in this document (or BREIT’s public filings). Except as otherwise required by federal securities laws, we undertake no obligation to publicly update or revise any forward-looking statements, whether as a result of new information, future developments or otherwise.
The following table reconciles preliminary estimated GAAP net income (loss) to preliminary estimated same property NOI for the six months ended June 30, 2023 and 2022 ($ in thousands). Same property NOI growth is estimated to be more than 7% year to date based on the midpoint of the estimated year over year increase.
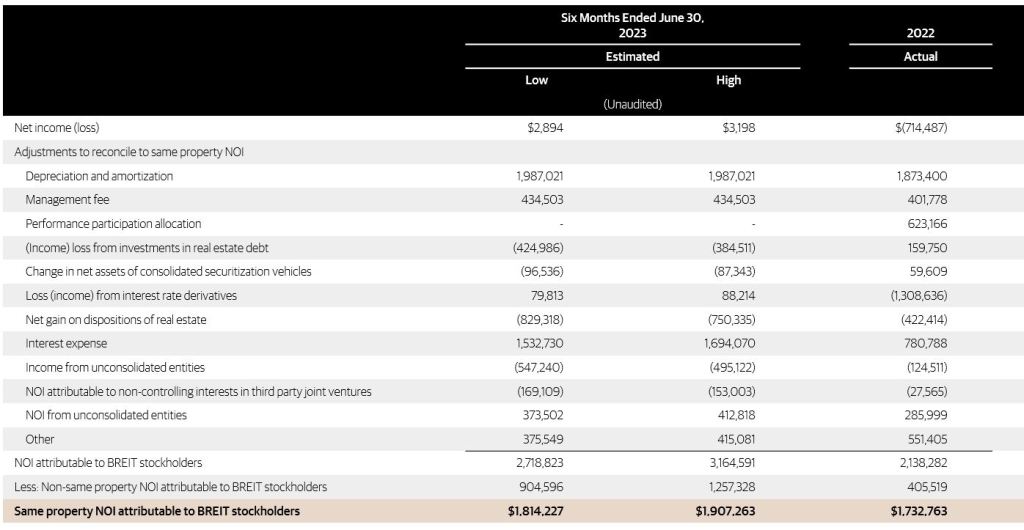
Note: See Note 4 for more information.